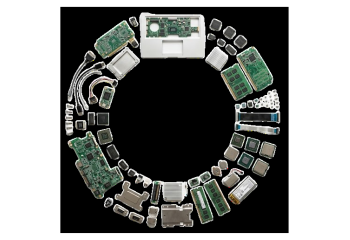
In 2022, the ICT sector caused an estimated 1.7% or more of global greenhouse gas emissions.
That amounts to roughly 567 million tonnes of CO₂ equivalent. Source: ITU and World Bank, Measuring the Emissions and Energy Footprint of the ICT Sector (2024).
A scientific study estimates the share of ICT at 2.1 to 3.9% of global greenhouse gas emissions.
This 2021 study takes more complete account of missing emissions in the supply chain. Its result is not directly comparable with the estimate for 2022. Source: Freitag and colleagues, The real climate and transformative impact of ICT (2021).
The production and use of devices accounted for an estimated 63% of the ICT sector’s greenhouse gas emissions in 2022.
Telecom accounted for 23% and data centres for 13%. The percentages are rounded. Source: ITU and World Bank, Measuring the Emissions and Energy Footprint of the ICT Sector (2024).
According to an EEB analysis, about 52% of a laptop’s climate impact comes from production, distribution and disposal.
The analysis assumes a lifespan of 4.5 years. Within that calculation, these phases together cause slightly more climate impact than the electricity used during use. Source: European Environmental Bureau (EEB), Coolproducts don’t cost the Earth (2019).
Using all laptops in the EU for one year longer could, according to an EEB calculation, save roughly 1.6 million tonnes of CO₂ emissions per year by 2030.
By the same calculation, that is comparable to the annual emissions of about 870,000 cars. This is a scenario from 2019, not a measured saving. Source: European Environmental Bureau (EEB), Coolproducts don’t cost the Earth (2019).
In 2022, 62 million tonnes of electronic waste were generated worldwide.
This covers discarded electrical and electronic equipment: from laptops and phones to household appliances. Source: Global E-waste Monitor 2024, UNITAR and ITU.
Of all electronic waste in 2022, less than a quarter was demonstrably collected and recycled in an environmentally sound way worldwide.
The documented share was 22.3% of the total weight. Source: Global E-waste Monitor 2024, UNITAR and ITU.
Between 2010 and 2022, the amount of electronic waste grew almost five times as fast as documented collection and recycling.
This refers to the increase in quantities by weight, not a comparison of percentage growth rates. Source: Global E-waste Monitor 2024, UNITAR and ITU.
In Europe, an average of 17.6 kilograms of electronic waste was generated per person in 2022.
That gave Europe the highest amount of electronic waste per person of all regions. Source: Global E-waste Monitor 2024, UNITAR and ITU.
If the current trend continues, the global amount of electronic waste could rise to 82 million tonnes per year by 2030.
This is a forecast from the 2024 report, not a certain outcome. Source: Global E-waste Monitor 2024, UNITAR and ITU.
According to the UN, an estimated 62 billion dollars’ worth of recoverable raw materials remained outside documented collection and recycling in 2022.
That shows how much value is not being used enough. ‘Outside the documentation’ does not automatically mean that all of these raw materials have been lost for good. Source: explanatory note from UNITAR on the Global E-waste Monitor 2024.